The risk from rising seas
![]() This is a part of the
Hazards
feature
This is a part of the
Hazards
feature
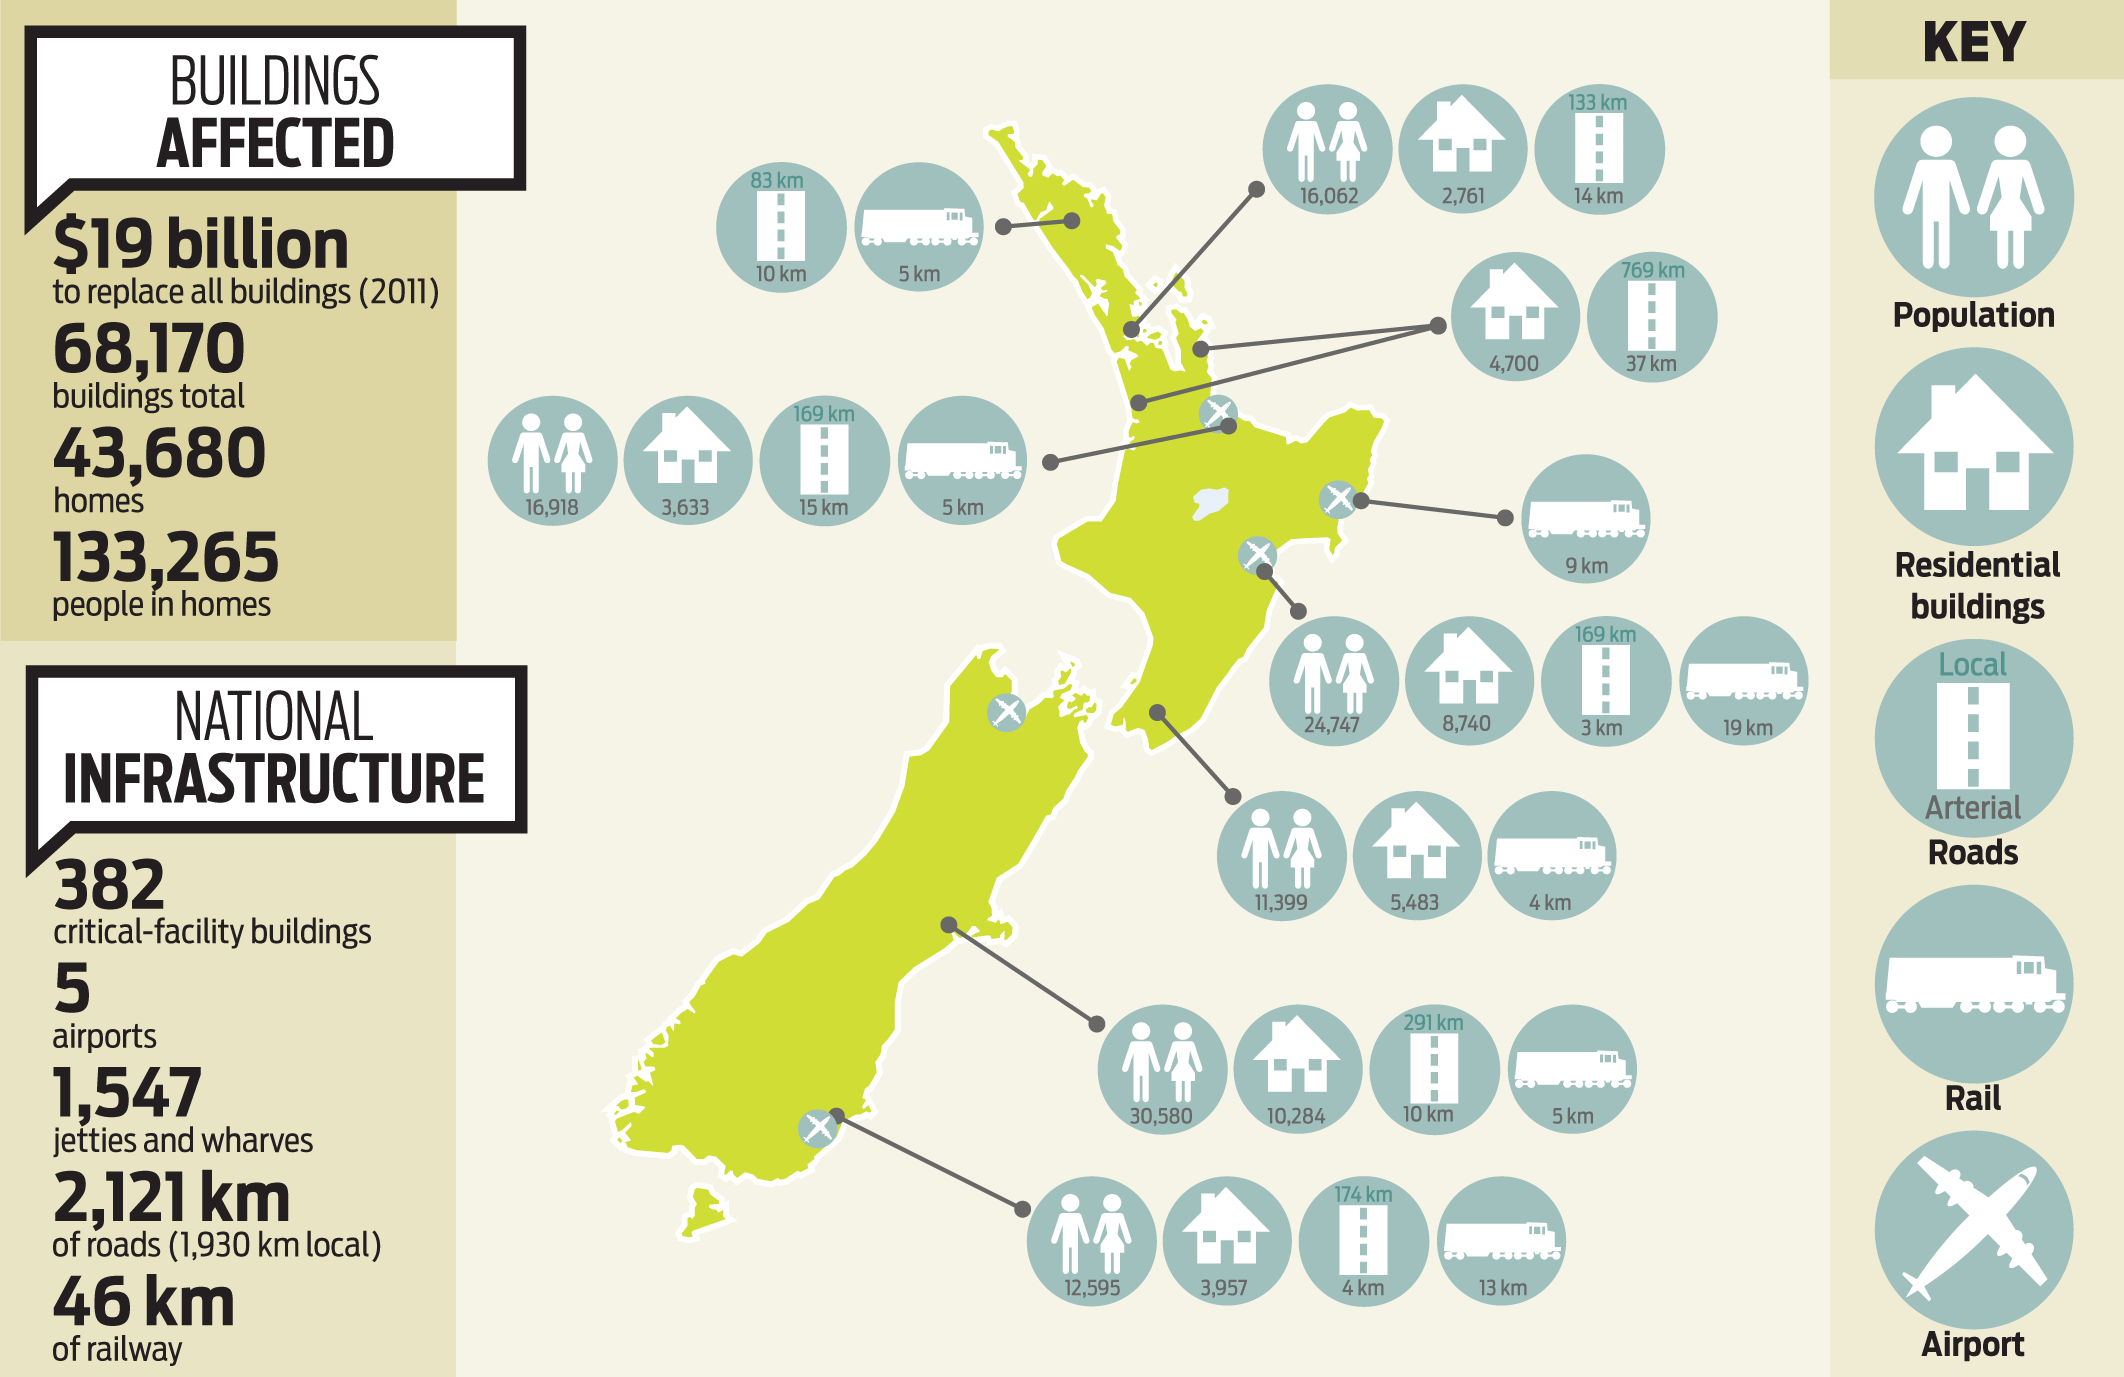
New Zealand’s long, narrow coastline is vulnerable to the rising seas climate change will bring. A national stocktake of coastal assets, including buildings, land and infrastructure, recently quantified this risk.

LATE LAST YEAR, the Parliamentary Commissioner for the Environment released the report Preparing New Zealand for Rising Seas. It includes information from NIWA on the regional and national risk exposure in low-lying coastal areas below 3 m above mean spring tide. Land area and parcels, population and all types of buildings and infrastructure such as roads, railways, airports, jetties and wharves are covered.
Stocktake of assets at risk
The NIWA report National and Regional Risk Exposure in Low-lying Coastal Areas is the first attempt to quantify the risk exposure in coastal areas across New Zealand. This enables comparisons in risk exposure between different regions and urban areas.
The report is a stocktake of what’s at risk within land that is 0.25, 0.5, 1, 1.5, 2, 2.5 and 3 m above the mean spring tide level.
Risk exposure for this study is expressed as counts of normally resident population, areas of land parcels and numbers or lengths of built assets or infrastructure within these elevation bands. The asset information comes from national databases in RiskScape, a joint venture project by NIWA and GNS Science.
Some areas missing accurate elevations
Resolving areas of coastal plains with such small increments in land elevation requires very accurate topographical data.
There are substantial areas of high-resolution elevation coverage across coastal areas mainly from LiDAR (light detection and ranging), a laser-based aerial scanning method for measuring elevations. However, some stretches of coast are still not covered.
Top exposure regions
Figure 1 shows a summary of the risk exposure in the 0 to 1.5 m elevation zone across regions with high-resolution LiDAR datasets available. The highest exposures by region are in Canterbury, Hawke’s Bay, Waikato (roads especially), Wellington and Otago.
Key findings for residents and buildings:
- Of the regions with LiDAR datasets available, two-thirds of people living in 0–1.5 m coastal elevation zones (from 2013 Census) are in:
- Canterbury (23%)
- Hawke’s Bay (19%)
- Bay of Plenty (13%)
- Auckland (12%).
- The main concentration of populations in these low-lying elevation zones are in urban areas or settlements.
- Canterbury and Hawke’s Bay, followed by Waikato (mainly Hauraki-Coromandel), have the most buildings of all types in the 0–1.5 m elevation zone. The Bay of Plenty and Wellington, including Lower Hutt, join this group with the highest building counts across the wider 0–3 m elevation zone.
- Dunedin (2,683), Napier (1,321) and Christchurch (901, excluding the red zone) have the most dwellings in the vulnerable lowest elevation band less than 0.5 m above spring tide mark.
- Canterbury, Auckland, Wellington and Hawke’s Bay regions dominate the building replacement cost national totals (using construction unit costs with floor area estimates in RiskScape). Across all areas with LiDAR available, the total replacement cost for all buildings is $19 billion (2011) on land below 1.5 m and rises to $52 billion for land below 3 m.
Local councils need to fine-tune risks
This type of national coastal census does not necessarily mean that these people and assets will be directly affected. However, it does mean they will potentially be exposed to coastal hazards and sea-level rise over differing timeframes – with lower elevation bands more likely to be impacted in the shorter term.
More in-depth regional or local studies by councils are required to demonstrate the likely risk to buildings and residents for specific scenarios of coastal hazards and sea-level rise over various timeframes. This information and mapping will then provide a more robust evidence base for engaging with potentially affected communities.
The Parliamentary Commissioner for the Environment report does, however, broadly indicate the extent of risk exposure nationally. It also shows which regions or urban areas are more at risk from rising seas in conjunction with coastal inundation hazards from storms or tsunamis.
Download the PDF
Articles are correct at the time of publication but may have since become outdated.


